Reading: Reshaping Data with the reshape Package
As part of the course Stat 585X I am taking this semester, I will be posting a series of responses to assigned course readings. Mostly these will be my rambling thoughts as I skim papers.
The paper we are reading this week is “Reshaping Data with the reshape Package” by Hadley Wickham, published in the Journal of Statistical Software, November 2007, Volume 21, Issue 12. As you may have guessed, the paper gives a good overview of what reshaping data is, why we would want to do it, and finally how we can reshape data easily.
What is reshaping data?
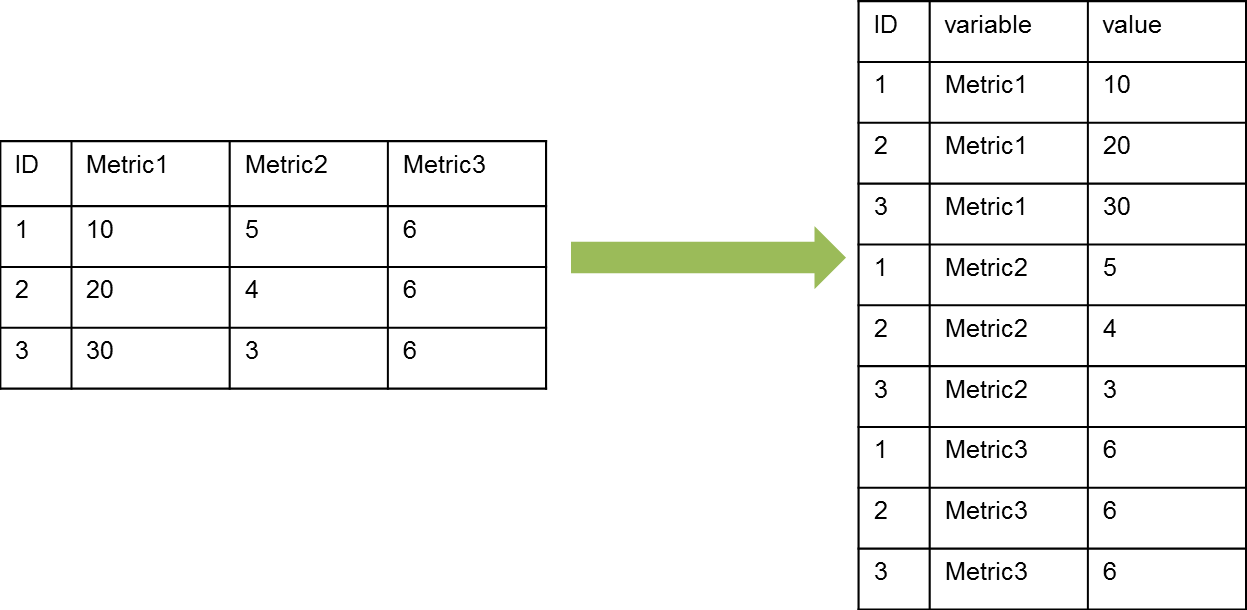
When we get data from almost any source it is rare to find it in a usable shape. Usually, data will be stored in a form that is either easy to collect, or easy to store. Most of the time, neither of these are very useful to us. Typically we will want to go from a “wide” format to a “tall” format (see diagram below), especially if we want to use ggplot2 to make interesting plots.

In a wide format, there may be multiple metrics associated with one identity, one row for each identity. In a tall format, there will be one row for each identity-metric combination and only one column for all the the metric values. The transformation between these formats is what is called reshaping data in the paper. Tall data is called “molten” in this paper and gives insight to the naming of functions in the reshape package.
Why do it?
Because What Would Hadley Do (WWHD)? But really, to quote the man himself, “Data often has multiple levels of grouping (nested treatments, split plot designs, or repeated measurements) and typically requires investigation at multiple levels.” We should reshape because it makes life a little easier and who doesn’t need that?
How can we reshape?
By using the reshape package, this paper highlights two useful functions: melt and cast. For a quick example of how to reshape, the paper uses the smiths dataset available in reshape. Let’s take a look.
Wide to Tall
library(reshape)##
## Attaching package: 'reshape'## The following objects are masked from 'package:plyr':
##
## rename, round_any## The following object is masked from 'package:lubridate':
##
## stamp## The following objects are masked from 'package:reshape2':
##
## colsplit, melt, recast## The following object is masked from 'package:dplyr':
##
## renameprint(smiths)## subject time age weight height
## 1 John Smith 1 33 90 1.87
## 2 Mary Smith 1 NA NA 1.54We can see here, there is a combination identity of subject and time with three metrics: age, weight, and height. By using reshape, we can easily transform this data into a molten or tall format.
(smiths.m <- melt(smiths, id.vars=c("subject", "time")))## subject time variable value
## 1 John Smith 1 age 33.00
## 2 Mary Smith 1 age NA
## 3 John Smith 1 weight 90.00
## 4 Mary Smith 1 weight NA
## 5 John Smith 1 height 1.87
## 6 Mary Smith 1 height 1.54Now we have a tall dataset with one column for the name of metrics and one for the values of these metrics.
Tall to Wide Having created our molten data frame, we may want to be able to get back the wide formula. This inverse functionality is also available in the reshape package.
cast(smiths.m, formula=subject + time~variable)## subject time age weight height
## 1 John Smith 1 33 90 1.87
## 2 Mary Smith 1 NA NA 1.54There are many options when it comes to specifying id variables and formulas in the melt and cast functions, but I will refer you to the paper for more details.
Additional Comments
In his paper, Hadley walks through in detail a lot of other situations including missing data, aggregation, higher dimensions, lists, and other convenience functions.
While all of these ideas and options are really useful, I’m going to let the expert do the talking and leave you with my thoughts on reshaping. It has changed my life! Not really, but kind of. I find myself using cast and melt more frequently than I’d care to count. Use it, and be amazed at how easy difficult reshaping in Excel can turn into one extra line of reproducible code.
blog comments powered by Disqus