Reading: Elements of a Viewing Data Pipeline for Data Analysis
As part of the course Stat 585X I am taking this semester, I will be posting a series of responses to assigned course readings. Mostly these will be my rambling thoughts as I skim papers.
This week we are reading a paper on the elements of a data pipeline for visualization by Andrea Buja, Daniel Asimov, Catherine Hurley, and John A. McDonald, a paper published in Dynamic Graphics for Statistics from 1988. This paper, as well as a video on the software Data Viewer, lay out some fundamentel steps that transform data to be visualized on a screen as well as taking results from an interaction and returning this as data.
What is a ‘Viewing Pipeline’?
A viewing pipeline is the sequence of steps necessary to transform a dataset to be visualized on a screen.
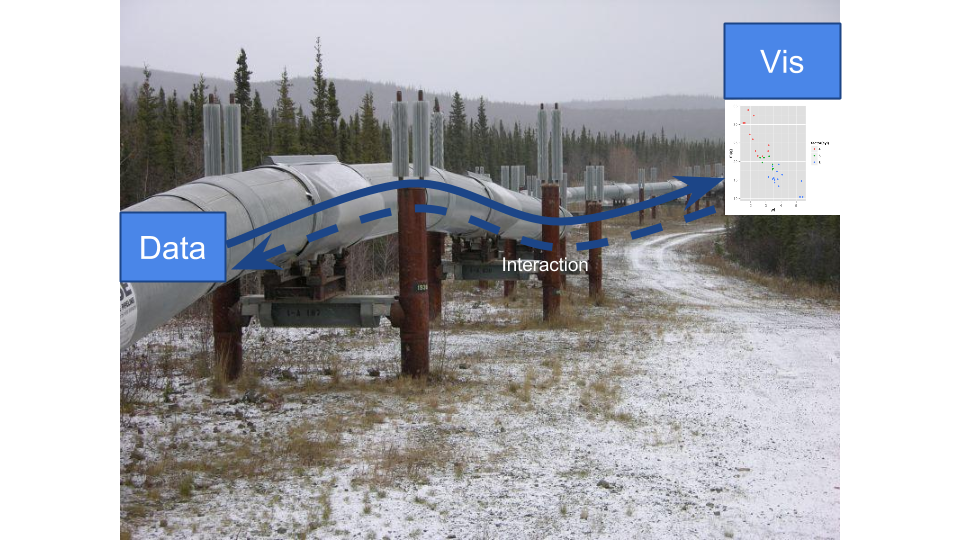
These can be thought of as a mapping of data points (transformations, rotations, projection, and clipping) to an (x,y) coordinate on a screen or paper. These operations are so prevalent in my daily life that I don’t often take the time to think of them formally. However, I did recently run into an example with my own research.
Example of a pipeline
For my masters project I was working with visualizing graph data. Graph data typically won’t come with an (x,y) for each point to then be plotted on a screen. Instead, a graph layout algorithm is used to calculate these coordinated. This can be thought of as the first transformation of a data pipeline. However, the fun isn’t over! These (x,y) coordinated will then need to be mapped to a set of (x,y) coordinated relative to their relation on a screen. I did this using an svg element on the screen sized to my own choosing, meaning I then needed to transform points based on this new coordinate system. This two step process was necessary simply to view a graph on the computer screen.
Of course, there is more to it.
A pipeline, however is more than just plotting. The pipeline can be used to pass manipulated data from the interactive graphic back through and edit the data, or create an alternative view of this data. For this reason, the authors advocate that any transformations (like rescaling or recentering) be invertible.
Respect the history
I found this paper to be quite interesting as a window back in time. Many of the elements presented in the paper and the Data Viewer software I recognize as precursers to the GGobi software, including projection pursuits and the grand tour. I also appreciated the appearance of visual inference and the lineup protocol in the paper.
blog comments powered by Disqus